Grass analysis 2020-2023, seasonality, average rainfall... lots of graphs!
I thought I'd actually collate and try and to understand if there are any trends in the pasture testing data (on our propery at Duffys Forest) I've done over the last couple of years. I have a very strong suspicion that alot of the advice that is taught and given out (including by myself) about pasture nutrients (especially sugars) is not necessarily relevant to all situations - I think it's highly influenced by location, climate, weather patterns, species etc... which is why I always recommend doing some of your own pasture testing to get a feel for what happens in your situation.
Sadly, I did not undertake the sample collection in a particularly scientific way - collecting a sample on the first day of every month for example would have been nice! Instead I was generally testing for a specific reason... typically I might have been worried about weight gain, or laminitis, or just checking to see if the grasses had matured enough to give lower sugar levels. This means there is a bit of a bias towards testing at times when I thought sugars might be high, and a lot less testing done in winter or high summer when the grasses were super mature. There are also lots of gaps, and some months had multiple tests, which I averaged to try and simplify the graphs...
But still, I think it's an interesting collection of information... I hope someone else out there does too :P Please feel free to comment with questions (I've tried to make certain information really clear, but I know not everyone is familiar with looking at graphs!) or observations I might not have seen!
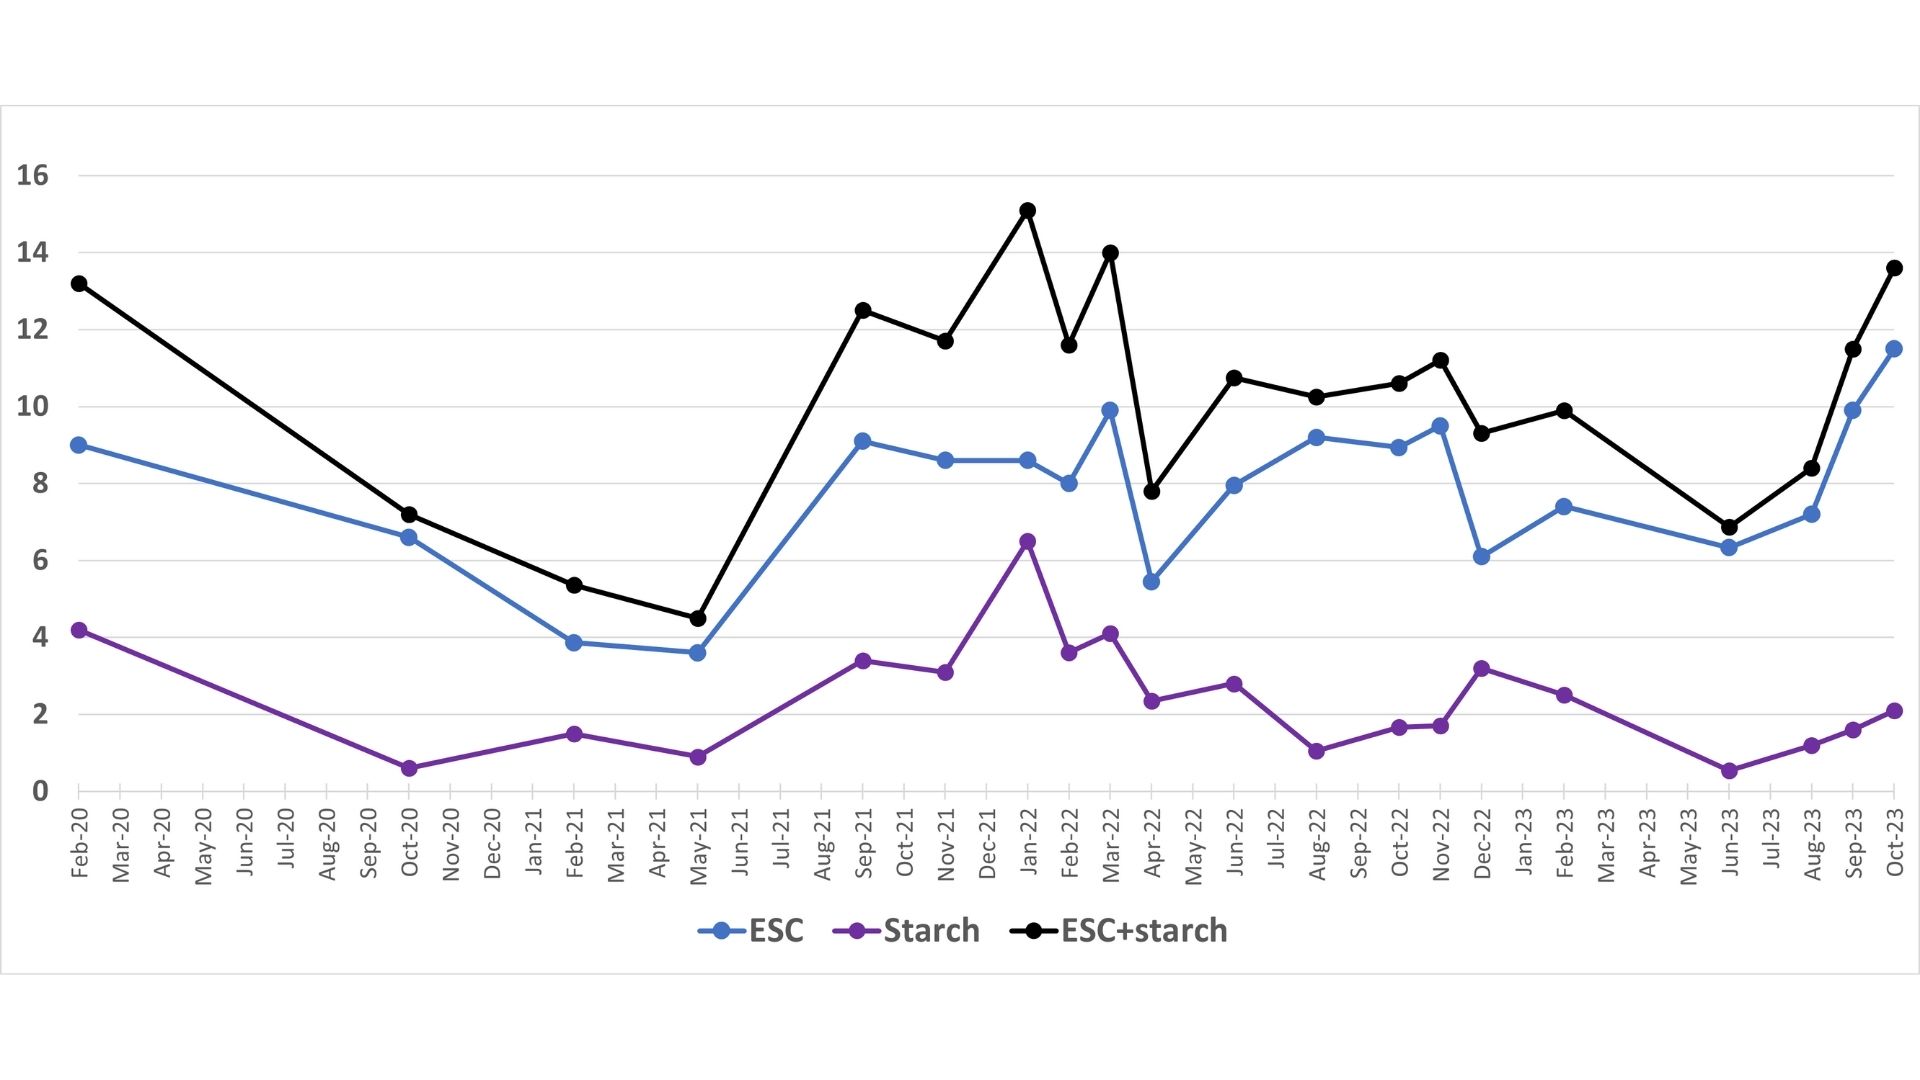
First things first, this is the ESC and starch percentages from Feb 2020 until October 2023, with no other information. You can see frequency of testing has increased as time goes on - there may well have been more variation in 2020 that I didn't catch in the two samples I took.
I'm now going to add some context to these lines... adding in the "safe" thresholds for laminitis/insulin resistance, and also the period where our Hakon had his laminitic episode. I highlighted the preceding 6 months as it was consistently above 10% ESC+starch - strikingly this was mostly because of the starch content being consistently above 3%, which is quite unusual.
I didn't mark it on the graph, but Hakon actually returned a normal insulin test in October 2021. This suggests to me that it took quite some time for his metabolism to start to struggle in this environment (he was also for various reasons not in very much work at this time), to the point where actually got laminitis - it was not a single day or even week of high sugars that triggered it. He also had no hoof rings until the laminitic episode in March - hoof rings are known to be predictors of laminitis (as they can indicate subclinical changes in the hoof).
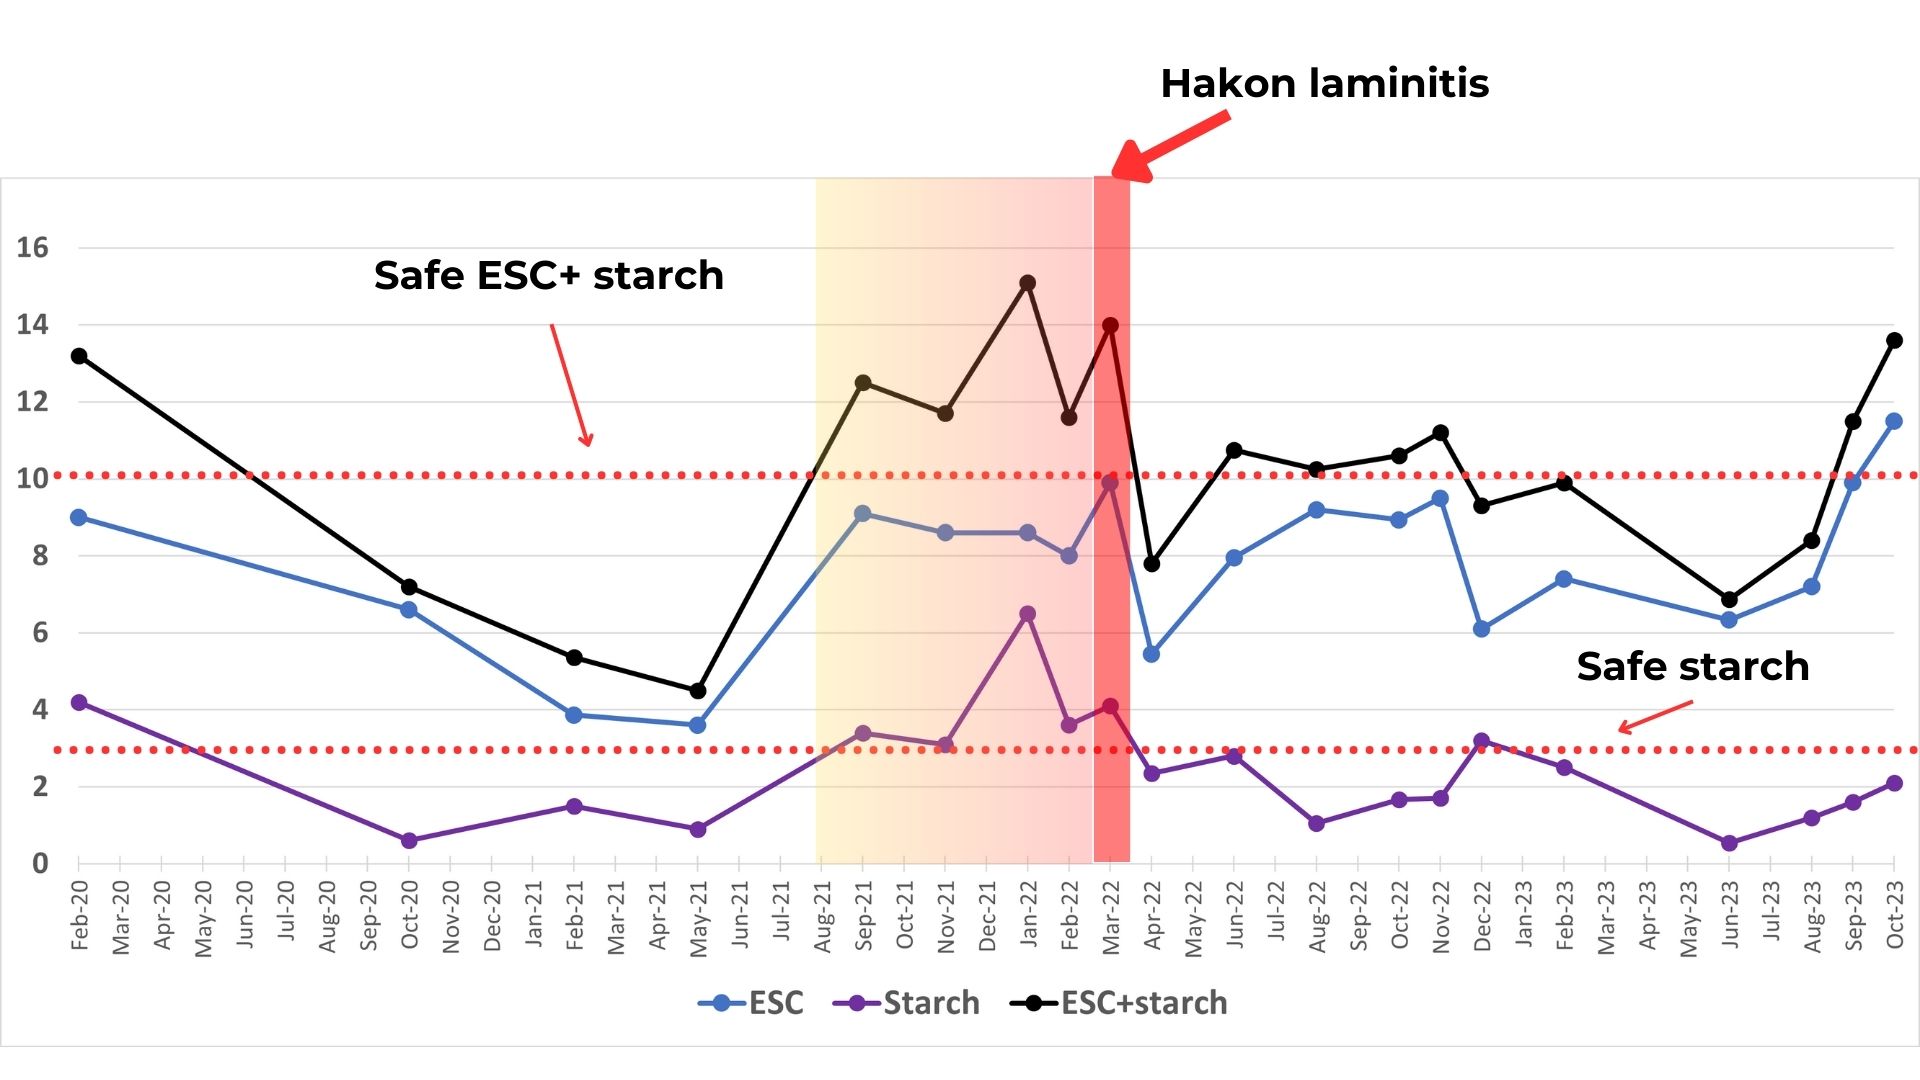
So from here, I wanted to see if there was some sort of predictive pattern to sugars and starches - as you can see there have been periods of very low sugars and also moderate (even our highest ESC+starch at 15% is not crazy high in the scheme of highly productive species). The average result is just under 10%.
Firstly, lets look at seasonal patterns...
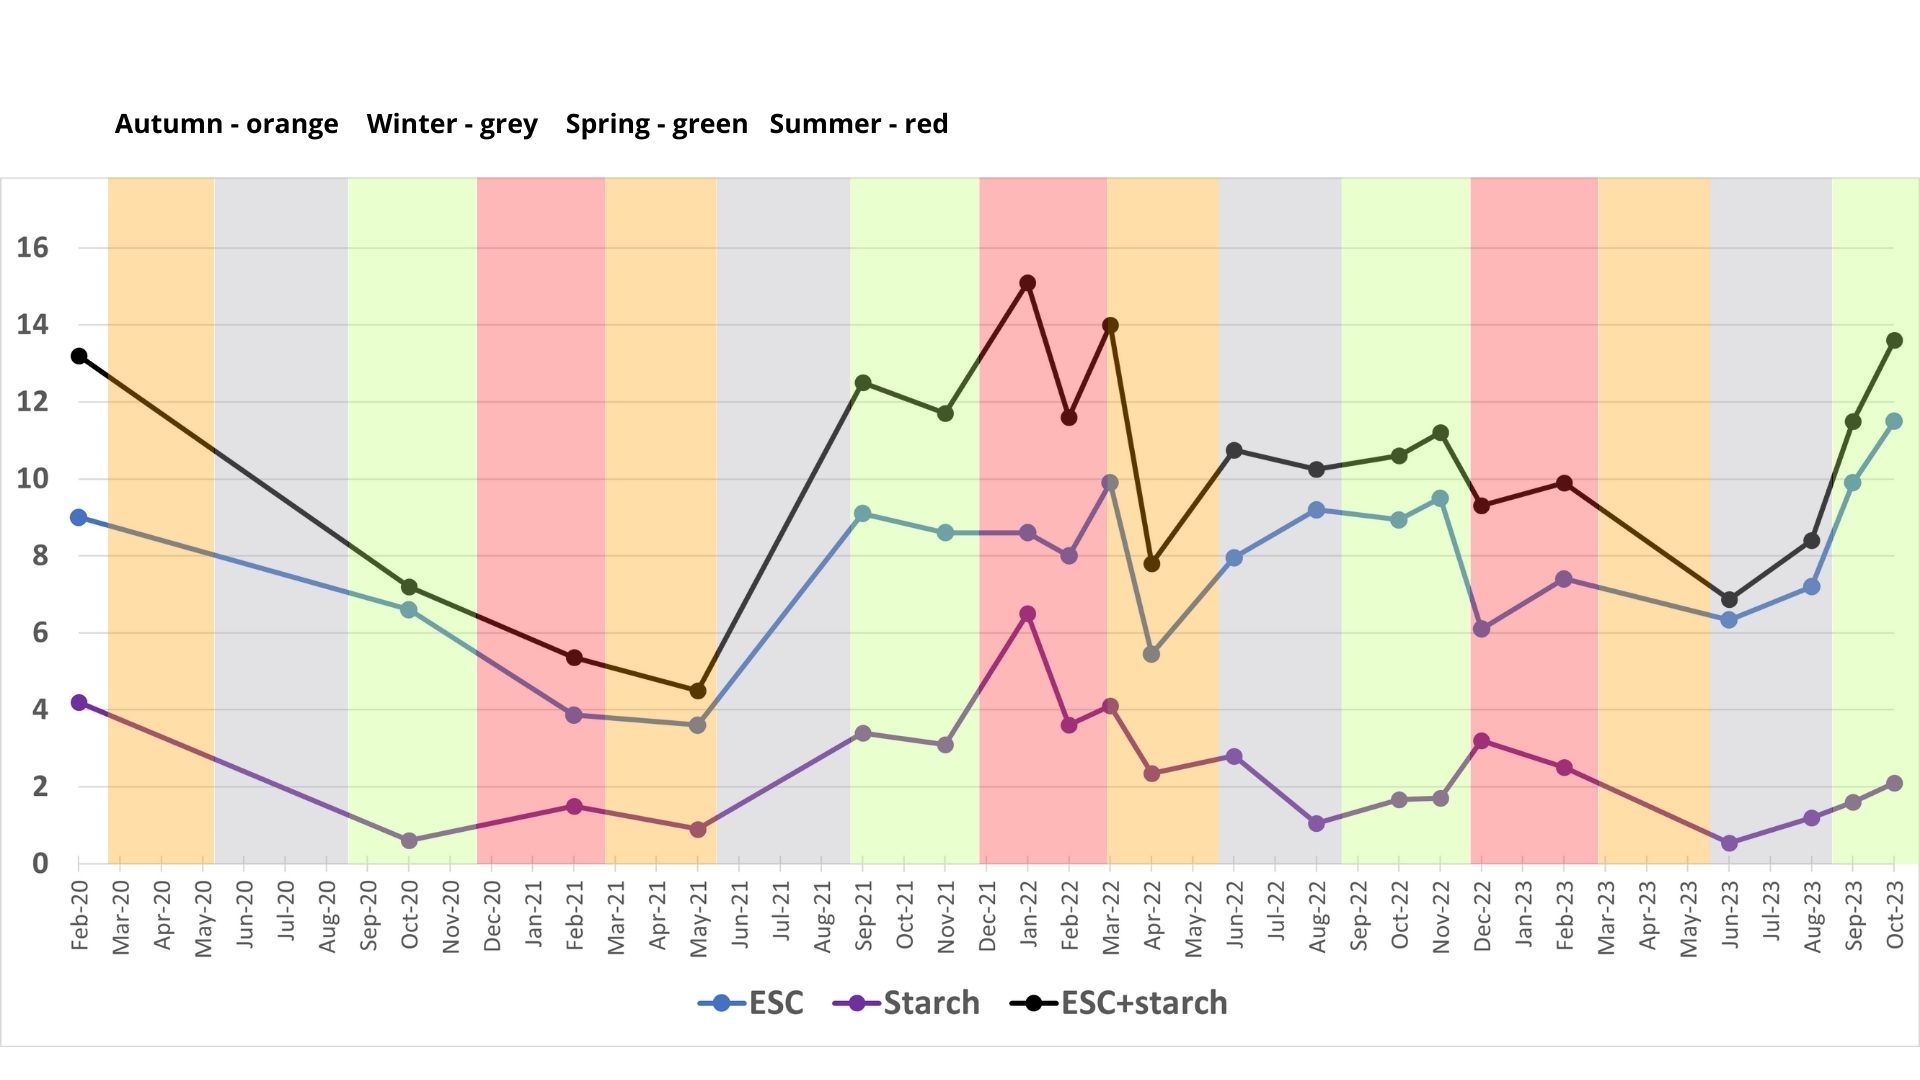
Focus on all of the green colour bands (spring) for example - the sugar/starch levels are all over the place with no clear seasonal pattern! Autumn seeeeeems to tend to have slightly lower results, but it's still pretty variable. This is quite contrary to a lot of northern hemisphere research - which makes perfect sense as in our climate, autumn sees the gradual end of full throttle summer growth of our warm season C4 grasses - long, mature, fibrous plants that the horses tend not to like! In cooler climates the warm season grasses die off earlier, allowing C3 species to get going in autumn, something we don't get. We also don't get frosts in autumn here.
So seasons don't seem to explain the fluctations. What about rainfall? I think we all recall that the last couple of years were very wet, and I know the paddocks were extremely waterlogged (even though we have reasonable drainage being on a slight slope). I went to BOM and got the monthly rainfall ranges...
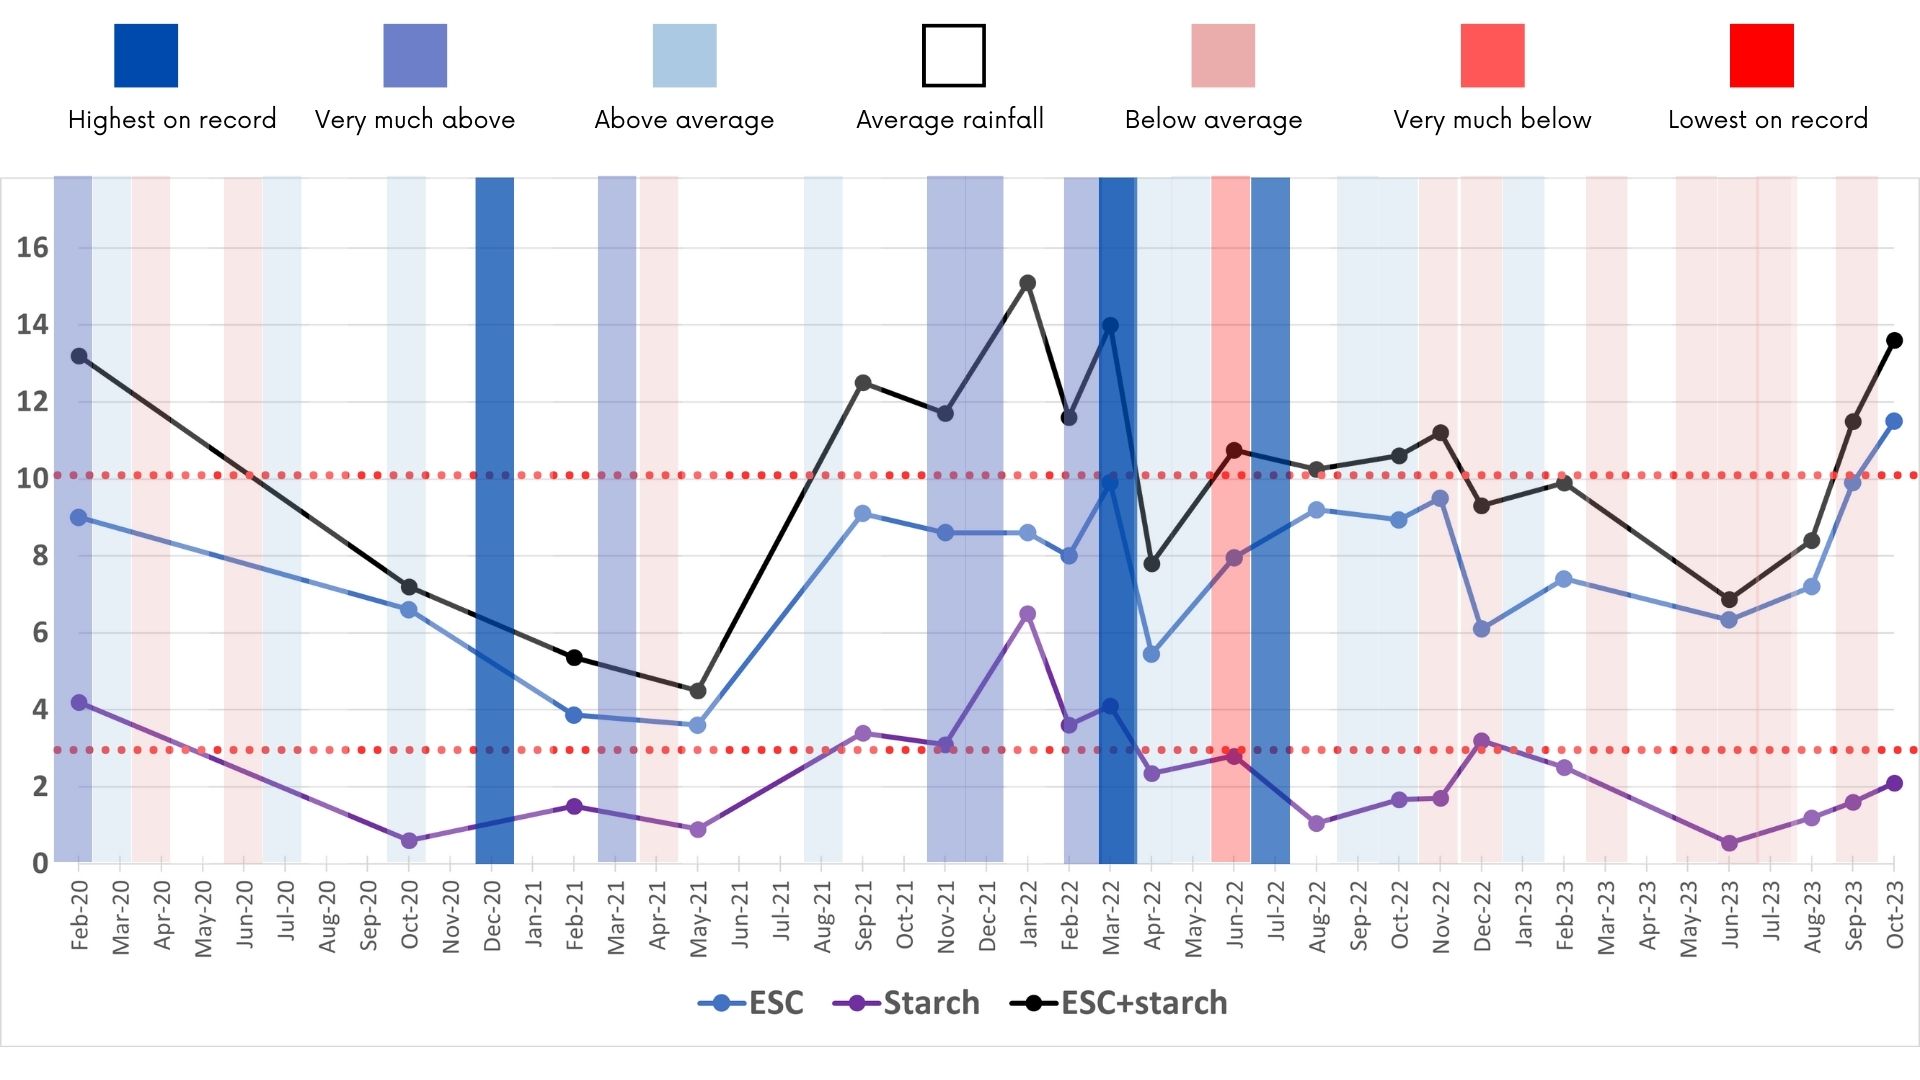
I was quite suprirsed to see average and below average months in 2021, but there you go! Having said that, you can see that there's a lot more blue in the lead up to our high sugar periods, and very little dry periods. Rain, on rain, on rain, may be a potential stressor in the grasses, leading to abnormal starch accumulation. Certainly I remember that the grass grew to a point in spring/summer 2021, but then seemed to just get "stuck" and sit there at about knee length (when normally it would continue to grow well past this height in the summer).
If we look at the lower sugar periods (April 2020- July 2021 and Aug 2022-Aug 2023) it looks to me like we have more variable rainfall each month, some months it rained more, some less, but the overall rainfall looks more average over those time periods - no long periods of wet OR dry. It will be interesting to see what happens over the next few months as we seem to be in an extended mildly dry period and sugars are currently going up (although we have had a lot of rye and C3 species in those last couple of samples, which may not be 100% representative). I'll have to extend the graph in a couple of months and see what role the species change has (when our kikuyu, paspalum and rhodes grass dominates) V the weather patterns.
It makes sense to me that anything above or below "normal" will challenge the plant and may lead to stress accumulation of sugars.
I could have gone on to look at temperatures etc... but I do have a life (lol) and had to stop somewhere. Can do by request though!
Finally I also plotted digestible energy (calories), crude protein and sugars on one graph to see how they vary compared to one another.
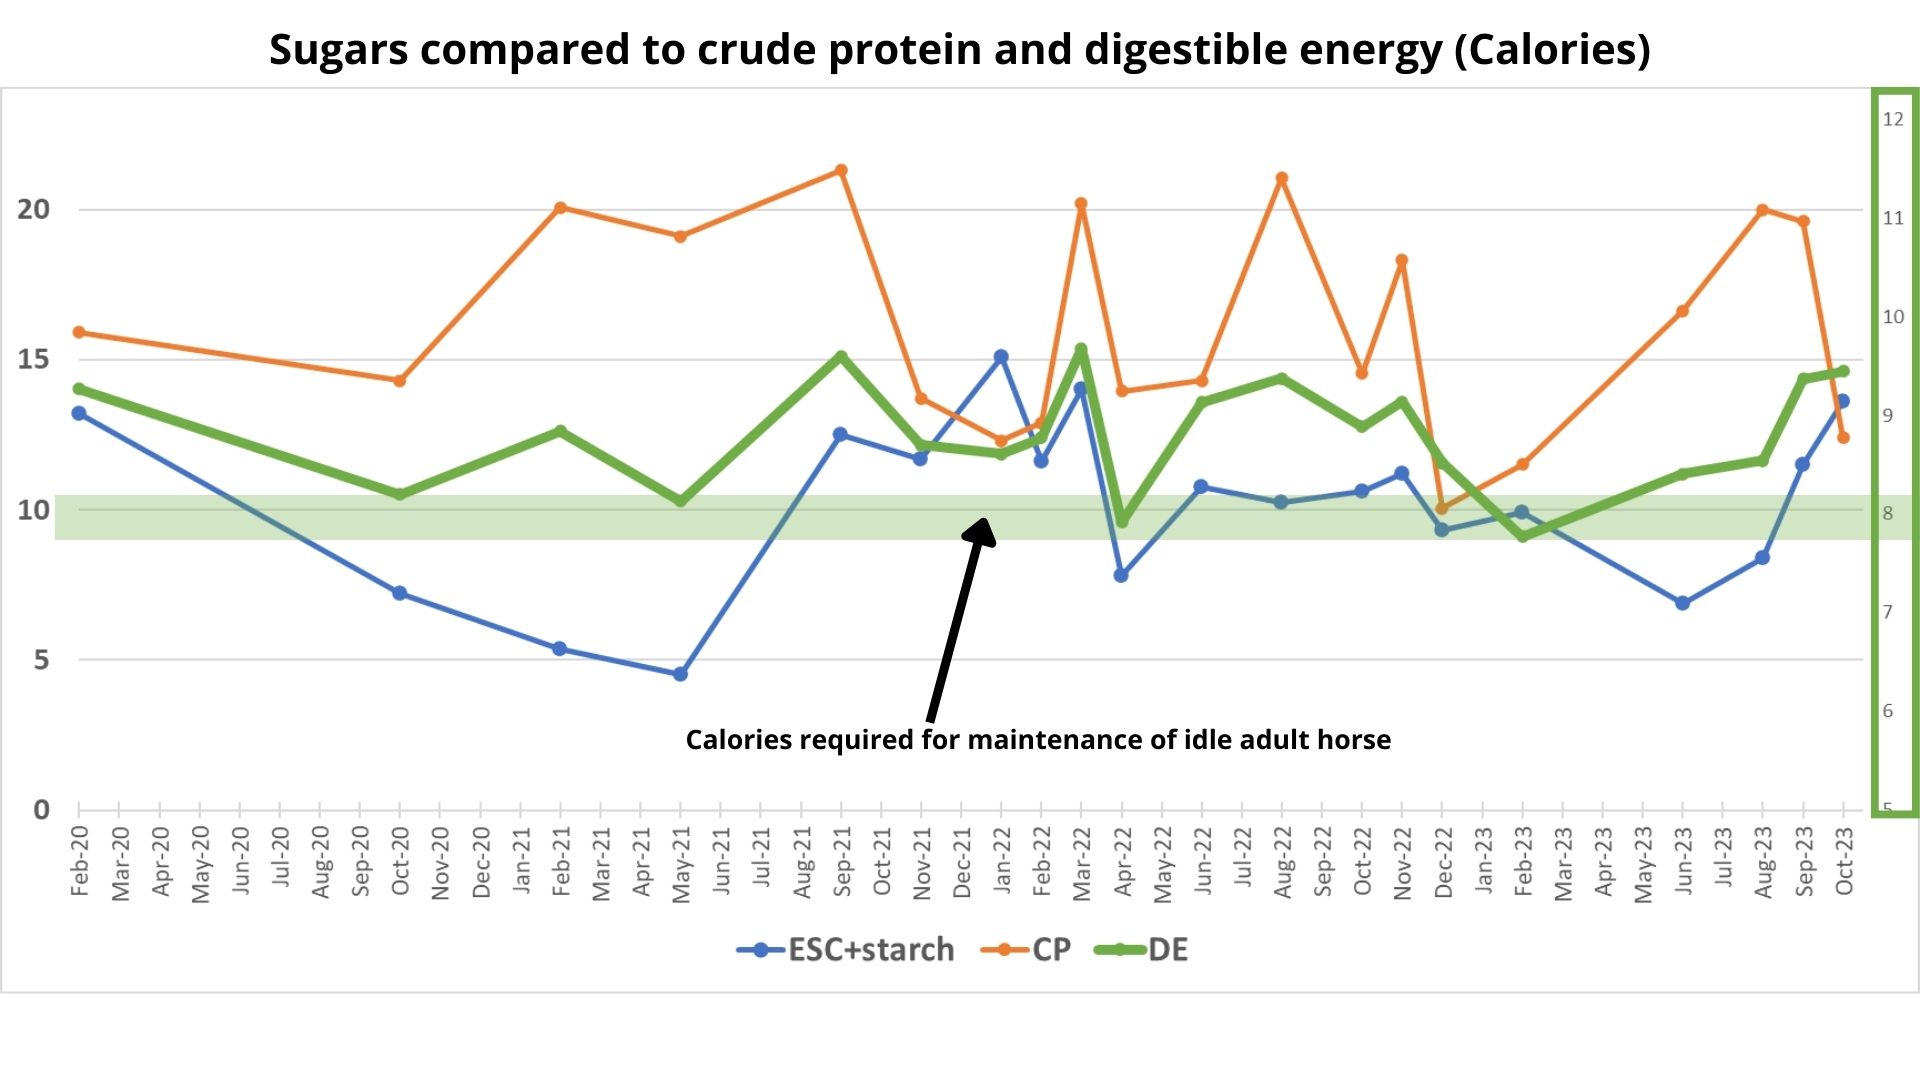
This graph might be a little more confusing as energy is measured in a different unit (megajoules), which is on the right hand axis, than protein and sugars (which are a percentage) on the left. The pale green horizontal bar shows the approximately level of calories needed to maintain weight on a horse at rest (just under 80MJ). So it's not too hard to see why our horses always tend to be a little on the chunky side! Having said that, I always sample the "best" of the paddock - not the whole plant, so as they graze down the area they will actually be accessing lower levels of nutrients over time.
I thought the most interesting part of this graph is how it shows that sugars and proteins are often (but not always...) inverseley related - that is that protein tends to be high when sugars are lower - and this is a well described phenomonem in grasses as protein tends to be high in fast growth plants, which are using up their sugars from growth rather than storing them for later.
Calories overall do not seem to be influenced strongle by either protein or sugars alone, but a combination, which makes sense as the horse extracts energy from many different nutrient fractions (and the biggest one being digestible and fermetable fibres, which now I think I should have plotted too! Again, happy to do so if anyone wants!).
Keen for comments and questions!